
- What is the Annual Cost Breakdown for Fintech Apps by Scale?
- What Drives Fintech Mobile App Maintenance Costs Each Year?
- Which Fintech Costs Sit Inside or Outside the Maintenance Ratio?
- Why Does a Fintech App Cost More to Maintain in Year One?
- How Does Annual Maintenance Differ by Institution Type?
- Who Should Maintain a Fintech Mobile App After Launch?
- Which Compliance Requirements Add to Annual Fintech Maintenance?
- What Does Post-Launch Support Cover in Year One?
- What Should You Know Before Requesting a Maintenance Estimate?
- How Does Space-O Canada Help You Control Fintech App Maintenance Costs?
- Frequently Asked Questions About Fintech Mobile App Maintenance Cost
Fintech Mobile App Maintenance Cost: A 2026 Budget Guide

 Last Updated: November, 16 2026

Key Takeaway
- Annual upkeep runs about 15% to 25% of the original build, with compliance audits budgeted as a separate line.
- The scale section converts build size into yearly run cost using sourced worked examples.
- The driver table separates the fintech costs that sit inside the ratio from those that sit outside it.
- The later sections cover first-year spend, institution-type bands, maintenance models and the compliance work behind the bill.
Fintech mobile app maintenance typically costs $30,000 to $120,000+ per year for mid-size and regulated builds, and smaller apps land below that. The usual rule of thumb is 15% to 25% of the original development cost each year. Regulated platforms often exceed that ratio, because compliance work such as security audits, KYC/AML updates and PCI-DSS scope rarely shrinks after launch.
That premium rarely arrives as one big bill. It builds up through small, unplanned fixes: an iOS release changes a permission, or a payment API retires an endpoint months after launch. The fix then lands inside an audit window, and the unbudgeted work gets written up as an incident.
Most published cost guides price upkeep as a share of the original build. That method works for fintech, and it is where this page starts too. The gap is what the ratio leaves out, starting with regulated audit costs. Many guides leave those lines unpriced, and this page sets them out in dollars.
Before the numbers, a note on who is writing them. Space-O Canada is a fintech app development company that builds software for banks, credit unions, lenders, insurers, payment service providers, wealth managers and funded fintech startups. Every project includes post-launch support from the team that built it, detailed below. Figures below are market ranges, and ranges marked indicative are directional. None is a Space-O Canada quote.
What is the Annual Cost Breakdown for Fintech Apps by Scale?
A fintech app’s annual maintenance scales with its build cost, at roughly 15% to 25% per year. These worked examples apply that rule:
- A $100,000 fintech app: $15,000-$25,000/year.
- A $150,000 fintech app: $22,500-$37,500/year.
- A $200,000 fintech app: $30,000-$50,000/year.
- A $300,000 fintech app: $45,000-$75,000/year, applying the same 15% to 25% rule.
Published tiers show cost by complexity
The published tiers below show where fintech apps land once complexity and regulation are priced in. All sources are dated October 2026.
| Tier | Annual maintenance (USD) | What pushes it there |
|---|---|---|
| Standard or mid-complexity fintech app | $30,000-$60,000 | Core security updates, hosting, OS releases |
| Complex regulated fintech platform | $60,000-$120,000+ | Heavy audits, multiple payment and KYC vendors |
| Fintech/banking industry row | $30,000-$100,000+ | PCI-DSS compliance, fraud detection updates, security audits |
| Enterprise build ($150,000-$500,000) | $22,500-$125,000 | Ratio applied to larger builds |
| Complex fintech (ratio view) | Above a quarter of build cost, or a dedicated product budget | Upkeep outgrows the standard curve |
Enterprise-scale platforms often cost significantly more than any of these bands. Apps that hold no customer funds are a separate case. Space-O Canada’s Paper Trader virtual trading simulator, shows app types that hold no customer funds.
Plan Your Fintech App Upkeep Budget
Tell us your build and regulators, and we will map your yearly maintenance costs.

Scale sets the floor for annual upkeep. The next question is which line items push a fintech app above that floor.
What Drives Fintech Mobile App Maintenance Costs Each Year?
Six recurring cost drivers make up most fintech maintenance budgets, and security leads the list:
- Security Audits & Penetration Testing: Payment apps need regular vulnerability scans, patching and at least one penetration test per year. Findings from each test then need fixes and a retest, which adds engineering hours after the report arrives.
- Regulatory & Compliance Updates: KYC/AML rules, PCI-DSS scope and SOC 2 evidence change, and the app must keep pace. Each change can touch onboarding screens, screening rules or evidence collection, so it needs development and testing time, not just a policy update.
- Payment Gateway & API Maintenance: Plaid, Stripe, KYC vendors and Banking-as-a-Service (BaaS) partners version their APIs and charge usage fees. Every version change needs integration testing, and a retired endpoint can break payments or onboarding if it is missed.
- Infrastructure & Cloud Hosting: Smaller apps often spend $70 to $320 per month on hosting, and busier platforms spend more. Costs also climb with monitoring, backups and separate test and production environments.
- OS & Platform Compatibility: Each iOS and Android release forces updates to SDKs, permissions and biometric login flows. Biometric and secure-session changes need testing on real devices before each release ships.
- App Store Fees: Apple charges $99 per year and Google Play charges $25 once. The fees are small, but Apple’s renews every year, and a lapsed account can block updates and fixes.
These six drivers recur across published estimates. Some fit inside the percentage rule, and some do not.
Which Fintech Costs Sit Inside or Outside the Maintenance Ratio?
The 15% to 25% ratio covers engineering upkeep. Audit costs for regulated finance apps fall outside that ratio. The table splits each driver accordingly. Ranges are indicative, and the classification column is our own reading. The security all-in and compliance and audit rows overlap, so count audit costs once when you total them.
| Cost driver | Indicative annual range (USD) | How we classify it |
|---|---|---|
| Penetration testing | $5,000-$15,000+ per test | Outside the ratio |
| Security audits | $1,000-$10,000 annually | Outside the ratio |
| Annual audit | $3,000-$10,000 | Outside the ratio |
| Security, all-in | $10,000-$50,000+ | Mostly outside the ratio |
| Compliance and audit | $20,000-$60,000+ | Outside the ratio |
| Payment, KYC and BaaS API fees | $5,000-$20,000+ | Usage fees outside; integration upkeep inside |
| Cloud hosting | $1,200-$12,000+ | Inside the ratio |
| OS updates and bug fixes | $5,000-$30,000+ | Inside the ratio |
Stack the outside lines on top of the ratio
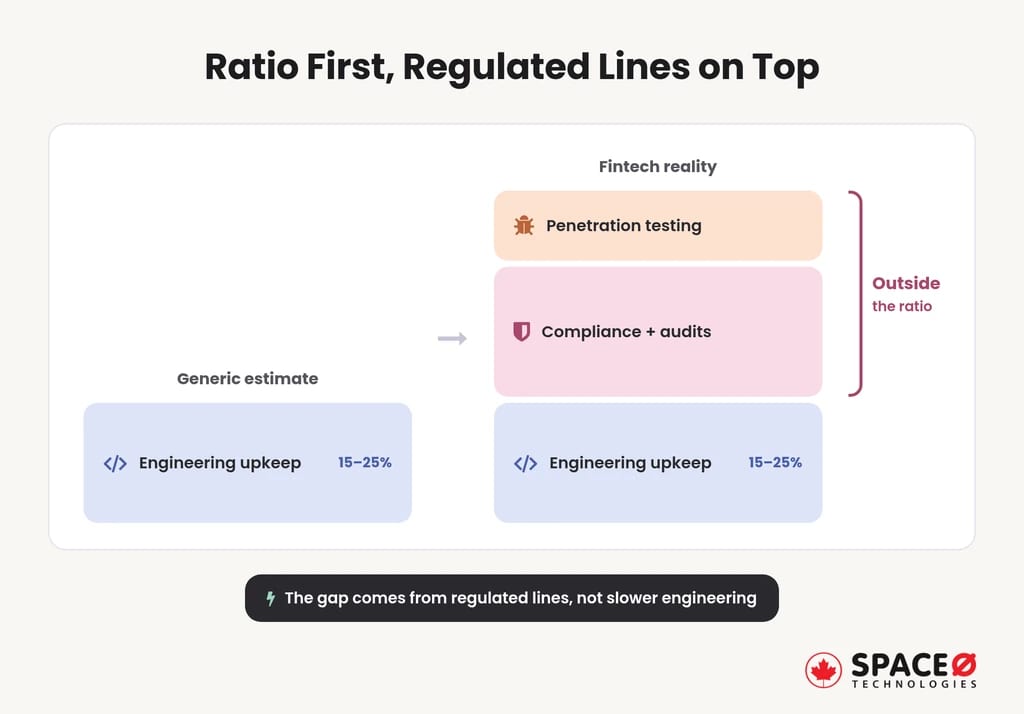
Start with the ratio, then stack the outside lines on top. Take a $200,000 build as an example:
- Engineering upkeep at 15% to 25% gives $30,000-$50,000.
- Adding $20,000-$60,000+ in compliance and audit gives $50,000-$110,000+.
- Adding penetration testing pushes the total toward the top of the headline range.
That arithmetic explains why fintech budgets outrun the generic ratio. The extra spend comes from regulated line items, not from slower engineering.
Separating the two kinds of cost turns a vague ratio into a defensible budget. Timing matters too, because year one rarely looks like year three.
Why Does a Fintech App Cost More to Maintain in Year One?
A fintech app’s first year often runs well above its steady-state maintenance cost. Year one runs heavier for three reasons:
- Codebase stabilization: Real transaction volume exposes defects that testing never reached. Edge cases in payment flows, timeouts and device mix only show up at scale, so the first months carry extra fix and release work.
- First security cycle: Payment apps start their recurring vulnerability scans and patching from a cold baseline. The first scan usually surfaces a backlog of findings, and clearing it takes more effort than keeping up with later cycles.
- Vendor tuning: KYC and payment integrations get adjusted once real customers hit them. Real users trigger verification failures, declined payments and retry cases that sandbox testing rarely reproduces.
Applying a year-one share of 40% to 50% and a steady-state share of 15% to 25% to a $150,000 fintech app gives $60,000-$75,000 in year one, then $22,500-$37,500 per year.
That extra year-one spend is front-loaded catch-up work. Defects found under real transaction volume, vendor tuning and the first full security cycle are one-time costs, so plan for spend to taper toward the steady-state ratio rather than repeat.
Year one is a stabilization cost, not a new normal. What normal looks like afterward depends on the type of institution running the app.
How Does Annual Maintenance Differ by Institution Type?
A fintech app’s annual maintenance follows what the app does with money, not just the institution’s size. The bands below reuse the tiering above. No source publishes institution-specific figures, so treat them as directional.
| Institution type | Drivers that dominate upkeep | Likely band |
|---|---|---|
| Banks and credit unions | Core banking integrations, KYC/AML updates, PCI-DSS for card features | Complex regulated: $60,000-$120,000+ |
| Lenders and mortgage providers | Decisioning audit trails, credit data APIs, KYC/AML | Standard/mid to complex |
| Payment service providers | PCI-DSS scope, gateway and processor APIs, fraud updates | Complex regulated: $60,000-$120,000+ |
| Insurers | Policy and claims system integrations, document processing | Standard/mid to complex |
| Wealth, investment and trading firms | Real-time market data, order flow, security audits | Complex regulated: $60,000-$120,000+ |
| Funded fintech startups | BaaS partner fees, KYC vendor costs, first audits | Standard/mid: $30,000-$60,000 |
Trading firms feel market-data and order-flow upkeep first, which shapes our trading and investment platform builds. Institution type tells you which drivers will dominate. The team you choose decides how efficiently those drivers get handled.
Who Should Maintain a Fintech Mobile App After Launch?
Fintech app maintenance usually falls to one of three models: an in-house team, a generalist agency retainer or a fintech specialist. The right choice depends on how much regulatory weight each can carry.
| Factor | In-house team | Generalist agency retainer | Space-O Canada |
|---|---|---|---|
| Compliance scope | Depends on in-house regulatory expertise | Varies; confirm who owns compliance changes | Mapped in discovery, not bolted on in QA |
| Security baseline | Set by your own policies | Varies by contract | Encryption in transit and at rest, role-based access control, audit logging, segmented environments |
| Continuity | Full product context; coverage depends on headcount | Depends on staffing; handoffs possible | One in-house team from discovery to post-launch support |
| Legacy systems | Your own approach | Varies by agency | Phased modernization, not rip-and-replace |
| Post-launch support | Ongoing payroll cost | Retainer terms vary | Up to 90 days included on every project |
| Best for | Institutions with standing fintech engineering and compliance staff | Low-risk apps that hold no customer funds | Regulated apps where compliance scope must stay mapped |
Every build ships with biometric authentication, device binding and secure session handling, so maintenance hardens an existing security baseline instead of retrofitting one. One Space-O Canada banking client credited the team with managing both complex integrations and strict security requirements on its modernization project.
Compare Maintenance Models With Experts
Talk to a fintech engineer about in-house, agency or specialist support. Get expert advice before you sign any retainer.
The right model depends on how much regulatory weight your team can carry alone. That weight starts with the compliance programs below.
Which Compliance Requirements Add to Annual Fintech Maintenance?
Compliance is the main reason fintech upkeep costs more, so every annual plan should name each program it funds. For US fintech apps, the evidence points to three:
- PCI-DSS: Card-handling apps must keep cardholder-data scope current as code, vendors and infrastructure change.
- KYC/AML: Identity checks, sanctions screening and monitoring rules shift, and onboarding flows must follow.
- SOC 2: Some fintechs maintain SOC 2 evidence for partner banks, which adds recurring audit work.
Canadian rules add three more upkeep lines
Expanding into Canada means the annual budget must also fund upkeep for PIPEDA, FINTRAC and OSFI. Space-O Canada engineers its platforms to support all three, and its card systems are built to support PCI-DSS.
- PIPEDA governs how personal information is collected, used and disclosed.
- FINTRAC sets anti-money-laundering reporting duties for banking and payment flows.
- OSFI applies technology and cyber risk expectations to federally regulated financial institutions, and that work adds to the audit lines outside the ratio.
Each framework brings its own update cycle, which feeds the outside-the-ratio lines covered earlier. Because that work recurs by design, it belongs in every annual plan, and post-launch support is where it first shows up.
What Does Post-Launch Support Cover in Year One?
Every Space-O Canada fintech project includes up to 90 days of post-launch support at no extra line item. It covers the heaviest stretch of year one:
- Bug fixes: The engineers who wrote the code fix defects found under real transaction volume. Because they already know the codebase, fixes move without a handoff or a learning curve.
- OS updates: New iOS and Android releases get tested and patched promptly. Permission, biometric login and SDK changes are the usual pressure points, so they are checked first.
- Performance monitoring: Response times, crashes and API failures get tracked against launch baselines. Tracking against that baseline makes slow regressions visible before users start reporting them.
- After the window: The same team stays available for feature additions and platform scaling. That continuity means new work builds on a codebase the team already knows.
The window also sets a baseline. Crash rates, API error rates and release cadence recorded in these 90 days show what normal looks like for your app, so your yearly maintenance plan can be sized against real data instead of assumptions.
Ninety days covers the riskiest stretch after release. A precise annual estimate still depends on details only you can supply.
What Should You Know Before Requesting a Maintenance Estimate?
A reliable fintech maintenance estimate needs answers to five questions:
- What did the original build cost, or what will it cost?
- Which features does the app carry: payments, lending, trading or crypto?
- Which regulators supervise your institution today, and which will next?
- Will an in-house team, an agency or a specialist maintain the app?
- Which platforms and third-party vendors are involved? Count iOS, Android, any shared web or admin backend, and each payment, KYC or BaaS provider, since each versions its APIs and bills usage on its own schedule.
The first answer sets the ratio. The other four decide how much sits outside it.
Each answer maps to a line in the budget. The build cost fixes the starting ratio, the feature set shows which vendor and security lines apply, and the regulator list shows which audits and reporting duties sit outside the ratio. The maintenance model decides whether compliance ownership sits with your team or a partner, and the platform and vendor count tells you how many API versions and usage bills to track.
It also helps to bring existing audit reports, the findings from your last penetration test and a list of known defects or technical debt. Each one changes the scope of the estimate, because open findings often have to be closed before the next audit cycle begins.
Map Your Fintech Compliance Costs
Share your regulators and feature set. Our team maps the compliance work behind your yearly maintenance budget, line by line.
Clear answers to these questions turn a market range into a working number. Here is how Space-O Canada helps you reach that number.
How Does Space-O Canada Help You Control Fintech App Maintenance Costs?
Fintech app upkeep needs two budget lines: engineering work and separate audit costs. Plan both before launch, and year one holds fewer surprises.
Since 2018, Space-O Canada has delivered fintech software for 100+ clients, including Fortune 500 companies. 65% of our business is repeat and referral work.
Compliance scope is documented during discovery, so audit lines are named before launch. Maintenance is then scoped as two separate budget lines, engineering upkeep and regulated audit work, so neither hides inside the other. Because the team that wrote the code stays on after release, handoff costs stay out of your yearly budget.
Ready to put a number on your budget? Share your build cost and regulators below.
Frequently Asked Questions About Fintech Mobile App Maintenance Cost
How much does it cost to develop a mobile app?
Fintech builds in this guide range from $100,000 to $300,000. Yearly upkeep tracks build price at roughly 15% to 25%. On a $100,000 build, that means $15,000-$25,000 per year.
How much does it cost to make an app and maintain it?
A $150,000 fintech build costs $22,500-$37,500 per year to maintain at 15% to 25%. Year one often runs 40% to 50% of build cost, or $60,000-$75,000. Compliance audits sit outside both figures.
What is the typical annual cost of software maintenance?
For fintech mobile apps, the typical benchmark is 15% to 25% of build cost per year. That commonly summarizes to $30,000 to $120,000+. This guide does not price non-fintech software.
How much does it cost to keep an app going?
A live fintech app keeps paying for API usage, hosting, security audits and OS or bug-fix work. Only hosting and OS or bug-fix work sit inside the 15% to 25% ratio. Fund usage fees and audits on top.
What is a good annual maintenance cost?
A good fintech budget has two parts: engineering upkeep at 15% to 25% of build, and named audit lines. On a $200,000 build, the first part is $30,000-$50,000 per year. Judge it against steady-state years, not year one.
Does a fintech app that holds no customer funds cost less to maintain?
Not on the evidence here. This guide publishes no figure for apps that hold no customer funds, so any saving is unconfirmed.


Let’s Discuss Your Idea
Share your idea with our fintech development team and get a practical breakdown of what you need to build, integrate, secure, and launch it.
 Your project is covered by an NDAYour information stays secure and confidential




What our clients say


When we set out to build our Estate Tax Planning Tool, we needed a development partner we could trust with something this complex and consequential. Space-O Canada brought the technical expertise and attention to detail needed to handle intricate tax calculations and edge cases. They communicated clearly, delivered on time without cutting corners, and built a product we trust completely.
 Ed Chetan EdwinFounder, CharityCalc
We partnered with Space-O Canada to build a fintech platform that could support secure transactions, third-party integrations, and future scalability. Their team understood our business requirements from the beginning and delivered a well-architected solution without unnecessary complexity. Communication was consistent, milestones were met on time, and every challenge was handled proactively.
 Michael CarterCo-Founder, Digital Payments Platform
The fintech app came out exactly the way I pictured in terms of functionality. I will refer future UI/UX clients to their team. During the testing phase of the app, it performed according to the initial designs in terms of functionality. Their team was dedicated to creating the best version of the app and provided their own ideas to improve it.
 Amanda LewisProduct Manager, Lending Platform
Our banking modernization project involved complex integrations and strict security requirements, and Space-O Canada handled both with confidence. They developed a reliable banking platform that improved operational efficiency while maintaining a smooth customer experience. Their structured development process and clear communication kept the project on track from start to finish.
 Daniel RobertsVP of Technology, Regional Bank
Our legacy insurance system created delays across policy management and claims processing. Space-O Canada developed a centralized platform that streamlined our workflows and improved efficiency across departments. The project was delivered on schedule, and the team’s understanding of insurance technology was evident throughout the engagement.
 Emily FosterOperations Director, Insurance Provider
Developing a trading platform requires speed, reliability, and technical precision. Space-O Canada delivered a solution that performs exceptionally well while supporting real-time market data and intuitive trading workflows. Their project management was excellent, and the team remained responsive throughout every stage of development.
 Ethan MorganChief Product Officer, Investment Platform
The fintech app was successfully launched, and users loved its sleek design and features. Space-O Technologies worked in an organized and collaborative manner, allowing them to achieve quality results. They also took the time to deeply understand the project. They were very organized and had a good track record.
 David WilsonFounder, Personal Finance App