
Banking Software Development > Portfolio > Banking Analytics Software
Banking Analytics Software for a Canadian Banking Organization
A Canadian banking organization partnered with Space-O Canada to build a centralized analytics platform for bringing financial and operational data from multiple systems into one reporting environment. The client’s finance, operations, and management teams needed a more consistent way to access banking data, prepare reports, and review performance.
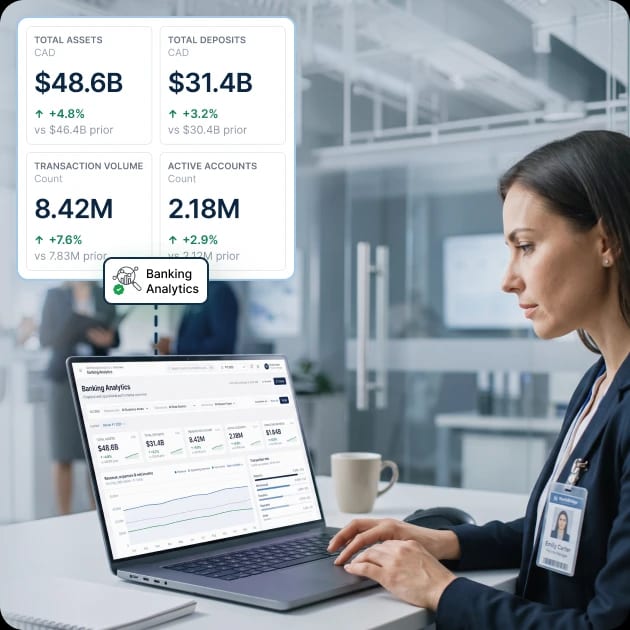
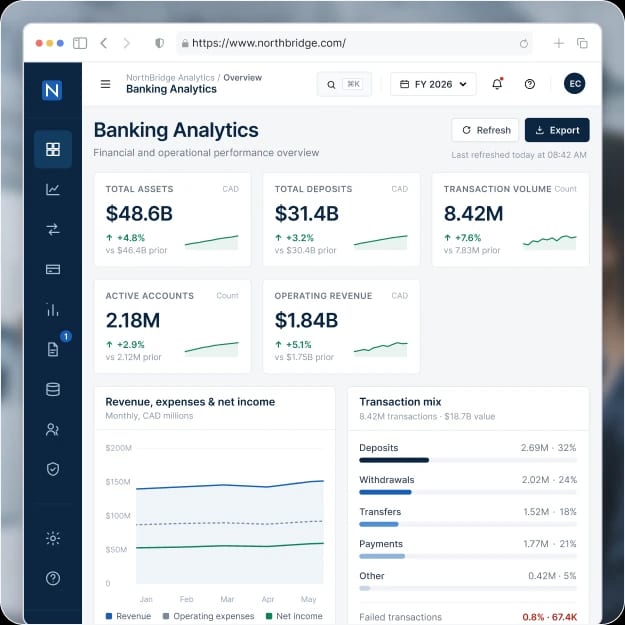
The platform brings relevant account, transaction, financial, and operational information together and presents it through centralized dashboards and reports. Authorized users can filter information by reporting period and other configured parameters, review key banking metrics, analyze transaction and account activity, and compare performance across selected business areas.
By bringing data and reporting workflows into one platform, the solution gives different banking teams a shared view of the information they need for financial reporting and performance analysis while maintaining role-based access to sensitive data.
About Our Client
Our client was a Canadian banking organization that needed to improve how its teams Our client was a Canadian banking organization that relied on financial and operational information from multiple systems. Different teams needed this information for recurring reporting, performance reviews, and day-to-day analysis, but the data was not available through a single analytics environment.
Finance teams had to consolidate information before preparing reports, while management needed to review financial and operational performance across different reporting periods. Analysts also needed to examine transaction and account activity without working across several separate sources.
The client wanted to centralize this information in one platform that could organize banking data for reporting and analysis, give teams a consistent view of performance, and control access according to user responsibilities.
Space-O Canada built a web-based analytics platform that brings the client’s financial and operational data together and provides dashboards, financial reporting, transaction analysis, performance views, filtering, and role-based access.
How We Built Banking Analytics Software
To address the client’s fragmented data and reporting workflow, we built the platform around six core areas: data integration, financial data processing, analytics dashboards, financial reporting, banking activity analysis, and access management. These components connect the underlying data with the dashboards and reports used by authorized banking teams.
Banking Data Integration
1
Requirement
The client needed to bring financial and operational information from multiple systems into one analytics environment. Users also needed the data to follow a consistent structure so they could use it across dashboards and reports.
Solution
We developed a data integration layer that connects supported data sources with the analytics platform. Incoming records are mapped to a standardized structure before they become available to the reporting and analytics modules.
This approach gives the platform a common data layer for dashboards and reports while keeping individual source-system connections separate from the user interface.
Financial Data Processing
2
Requirement
Data from different systems could follow different formats and structures. The client needed to organize this information before using it for financial reporting and analysis.
Solution
We implemented data processing workflows to validate, normalize, and organize incoming financial and operational records. The processed data is stored in a structured format that the analytics and reporting modules can use consistently.
This allows users to work with organized financial information instead of reviewing or combining source records manually for each reporting requirement.
Banking Analytics Dashboards
3
Requirement
Management and banking teams needed a centralized view of financial and operational metrics. They needed to review performance without moving between different systems and reports.
Solution
We developed interactive dashboards that present configured banking metrics through charts, tables, summary indicators, and trend views. Users can apply available filters to focus on specific reporting periods or business areas.
The dashboards give authorized users a consolidated view of the information relevant to their roles and provide a starting point for deeper analysis.
Financial Reporting
4
Requirement
Finance and operations teams needed to prepare recurring reports using the same information available in the analytics dashboards. The reporting process also needed to reduce manual data consolidation.
Solution
We developed a reporting module connected to the centralized data layer. Authorized users can select reporting periods, apply available filters, and generate structured financial and operational reports from the platform.
Using the same underlying data for dashboards and reports helps maintain consistency between the information teams use for analysis and the information included in formal reports.
Transaction, Account & Performance Analysis
5
Requirement
The client needed to examine banking activity beyond high-level financial reports. Users needed to analyze transaction volumes, account activity, and selected performance metrics across reporting periods.
Solution
We developed analytics views for examining transaction and account activity alongside configured financial and operational metrics. Users can filter information and compare selected periods to identify changes in activity and performance.
These views allow teams to move from summary-level metrics into specific areas of banking activity when they need additional context.
Role-Based Data Access
6
Requirement
Different banking teams required access to different reports, dashboards, and data. The client needed to manage these permissions without creating separate systems for individual departments.
Solution
We implemented role-based access controls that associate users with defined permissions. Administrators can control access to dashboards, reports, data views, and administrative functions based on each user’s role.
This allows finance, operations, management, and other authorized users to work from the same platform while limiting access to information and functions outside their responsibilities.
Key Features of the Banking Analytics Software

Centralized Financial Data
Bring financial and operational information from connected banking systems into one structured data environment. Standardize incoming records so teams can use consistent information across dashboards, reports, and analysis.

Banking Analytics Dashboards
Display configured banking KPIs through interactive charts, tables, summary indicators, and trend views. Let authorized users filter dashboard data by reporting period and other available parameters.

Financial Reporting
Generate financial and operational reports from centralized banking data. Allow users to select reporting periods, apply relevant filters, and produce structured reports without manually combining information from different sources.

Transaction & Account Analytics
Analyze transaction volumes and account activity through dedicated analytics views. Help users examine changes across reporting periods and investigate specific areas of banking activity.

Performance Analysis
Compare selected financial and operational metrics across reporting periods and business areas. Give management and banking teams a consistent way to review changes in performance using centralized data.

Role-Based Admin Dashboard
Manage users, roles, permissions, and reporting access from a centralized dashboard. Control which analytics and reports each user group can view based on their responsibilities.
Who Needs Banking Analytics Software Development

Commercial Banks

Retail Banks

Digital Banks & Neobanks

Credit Unions

Financial Institutions

Banking Finance Teams

Banking Operations Teams

Risk & Compliance Teams
Technology Stack
We selected technologies that support secure web application development, structured financial data processing, database management, analytics dashboards, and scalable cloud deployment.
Frontend Development
 React.js
Backend Development
 .NET
Database
 Microsoft SQL Server
Data Analytics & Visualization
 Power BI
Cloud Infrastructure
 Microsoft Azure
Authentication & Security
 Role-Based Access Control
Our Role in the Project
Space-O Canada served as the fintech development partner, focusing on banking risk management software development, risk data integration, assessment workflows, reporting, access controls, and QA.

Banking Analytics Software Development

Data Integration
Financial Reporting Development

Dashboard & Data Visualization
Role-Based Access Control

QA & Testing
Let’s Discuss Your Idea
Share your idea with our fintech development team and get a practical breakdown of what you need to build, integrate, secure, and launch it.
 Your project is covered by an NDAYour information stays secure and confidential




What our clients say


When we set out to build our Estate Tax Planning Tool, we needed a development partner we could trust with something this complex and consequential. Space-O Canada brought the technical expertise and attention to detail needed to handle intricate tax calculations and edge cases. They communicated clearly, delivered on time without cutting corners, and built a product we trust completely.
 Ed Chetan EdwinFounder, CharityCalc
We partnered with Space-O Canada to build a fintech platform that could support secure transactions, third-party integrations, and future scalability. Their team understood our business requirements from the beginning and delivered a well-architected solution without unnecessary complexity. Communication was consistent, milestones were met on time, and every challenge was handled proactively.
 Michael CarterCo-Founder, Digital Payments Platform
The fintech app came out exactly the way I pictured in terms of functionality. I will refer future UI/UX clients to their team. During the testing phase of the app, it performed according to the initial designs in terms of functionality. Their team was dedicated to creating the best version of the app and provided their own ideas to improve it.
 Amanda LewisProduct Manager, Lending Platform
Our banking modernization project involved complex integrations and strict security requirements, and Space-O Canada handled both with confidence. They developed a reliable banking platform that improved operational efficiency while maintaining a smooth customer experience. Their structured development process and clear communication kept the project on track from start to finish.
 Daniel RobertsVP of Technology, Regional Bank
Our legacy insurance system created delays across policy management and claims processing. Space-O Canada developed a centralized platform that streamlined our workflows and improved efficiency across departments. The project was delivered on schedule, and the team’s understanding of insurance technology was evident throughout the engagement.
 Emily FosterOperations Director, Insurance Provider
Developing a trading platform requires speed, reliability, and technical precision. Space-O Canada delivered a solution that performs exceptionally well while supporting real-time market data and intuitive trading workflows. Their project management was excellent, and the team remained responsive throughout every stage of development.
 Ethan MorganChief Product Officer, Investment Platform
The fintech app was successfully launched, and users loved its sleek design and features. Space-O Technologies worked in an organized and collaborative manner, allowing them to achieve quality results. They also took the time to deeply understand the project. They were very organized and had a good track record.
 David WilsonFounder, Personal Finance App