
- How Do You Integrate Transaction Monitoring With a Core Banking System in Five Steps?
- How Does Transaction Monitoring Integration With Legacy Core Banking Systems Work?
- How Does Every Alert Trace Back to Its Source Transaction?
- Which Integration Approach Fits Your Core: Real-Time, Batch, CDC or Hybrid?
- How Does Space-O Canada Help Integrate Transaction Monitoring With Your Core?
- Frequently Asked Questions About Integrating Transaction Monitoring Software
How to Integrate Transaction Monitoring Software With a Core Banking System

 Last Updated: November, 17 2026

Key Takeaway
- Integration means building a reliable data pipeline that feeds real-time or batch transaction and customer data into the monitoring engine. Space-O Canada, a fintech specialist, builds that layer onto the core you already run, in phases, with no rip-and-replace.
- The work runs in five ordered steps: scoping, data pipeline, rule configuration, parallel run and governed go-live. Each step names the control an examiner will test.
- A dedicated section covers legacy cores through four integration patterns, four challenges and four practices. It shows how to monitor a mainframe without changing its COBOL code.
- A field mapping table and a pattern-selection matrix show how each alert traces to its source transaction. A comparison table then weighs real-time, batch, CDC and hybrid approaches.
Transaction monitoring rarely fails at the monitoring tool. It fails at the seam between the core and the engine. Customer records arrive with mismatched IDs, card activity lands a day late, and a dropped batch goes unnoticed. Then an examiner asks why an alert fired, and nobody can walk it back to the ledger.
This guide covers the connection itself. It shows how core data reaches the engine and how each decision stays traceable. Our banking software development team builds these core-side connectors for banks, credit unions, lenders, and payment service providers. We build around whichever monitoring product the institution has already chosen.
The regulatory frame here is American. The FFIEC BSA/AML Manual governs program design, and FinCEN governs suspicious activity reporting. That reporting load keeps growing, with SAR filings up 7.99% in 2025 to more than 4.1 million. Dual-market products are covered under both frameworks, and compliance scope is mapped during discovery. For Canadian exposure, Space-O engineers platforms to support PIPEDA, FINTRAC and OSFI, plus PCI-DSS for card systems. With that frame set, the integration itself runs in five ordered steps.
How Do You Integrate Transaction Monitoring With a Core Banking System in Five Steps?
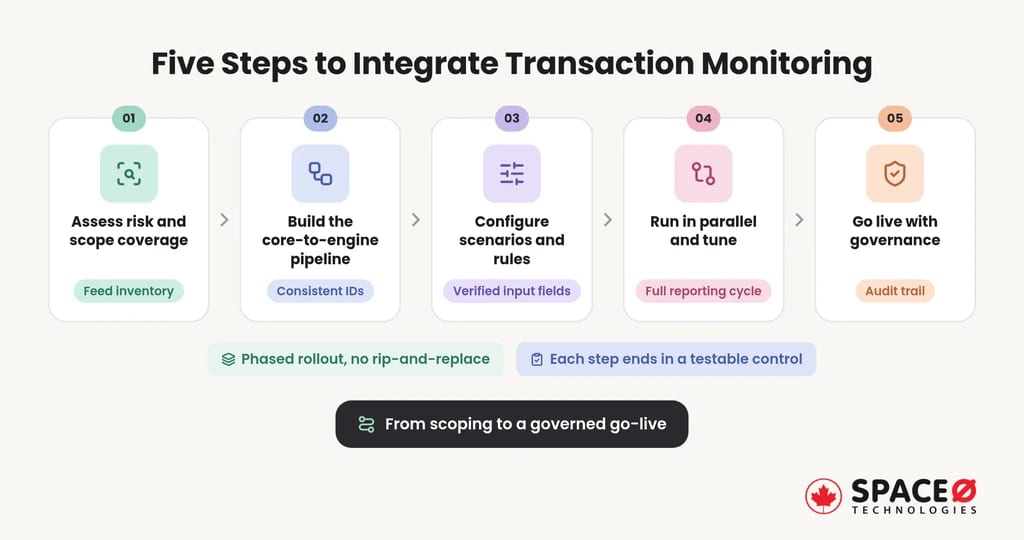
Five ordered steps take you from scoping to a governed go-live. Each step ends with a control an examiner can test.
Step 1: Assess risk and scope what the monitoring must cover
Risk assessment and scoping defines which products, channels, geographies and customer types the monitoring must cover. It comes first because scope decides which core feeds the integration needs. The FFIEC manual is the reference examiners use to judge that scope. If the buy-or-build decision is still open, our build vs buy banking software framework covers it.
- Scoping lists every system that moves money: the core, wire, ACH, card processors, payment gateways and KYC/CDD databases. The result is one inventory showing where every transaction and customer record originates.
- Scoping sets each channel’s urgency, such as whether card authorizations need screening before settlement. Instant payments and card authorizations usually rank higher than overnight file transfers.
- Scoping carries a trade-off: every added channel is another feed to reconcile before testing can start. Teams therefore rank channels by risk and bring them in waves, not all at once.
One constraint applies from day one. FinCEN sets a deadline for filing suspicious activity reports (SARs). Every hour of pipeline latency therefore shortens the time investigators have.
A written scope turns a vague mandate into a concrete list of feeds and deadlines. With that list in hand, the next job is moving the data reliably.
Step 2: Build the data pipeline from the core to the engine
The data pipeline connects the feeds scoped in step 1 into one stream the engine can read. Every record must carry consistent customer IDs across the core and the monitoring platform. Without them, the engine sees three strangers where one customer exists. Delays here usually come from the core’s extract limits, not from the monitoring product.
Choose real-time or batch for each use case
Real-time versus batch is a design choice made per use case, not per institution. Fraud interception needs events within seconds, before funds leave. Long-term AML patterns, such as structuring spread across weeks, can run on end-of-day (EOD) batch.
- Real-time feeds suit card authorizations, instant payments and outbound wires. In each case the decision has to land before the funds are final.
- Batch feeds suit pattern analysis across accounts, periods and counterparties. These patterns only show up when many days of activity are read together.
- Mixed feeds raise lineage effort, because two arrival clocks must reconcile to one record. A record that arrives twice, once live and once in a file, must still count as one transaction.
Most institutions run both modes. The pipeline should therefore tag every record with its arrival path. That tag lets investigators see how fresh the data was when a rule fired.
Pick the transport method that suits your core
Transport methods are the plumbing between core and engine, and each suits a different core. APIs and webhooks push events when the core exposes them. ETL jobs and flat files move scheduled extracts. Change data capture (CDC) reads the core’s transaction logs, and Debezium is one open-source tool for it. Kafka is a common event-streaming layer that buffers those events for the engine.
The transport choice matters less than the controls wrapped around it. Field-level controls live in the alert-tracing section after the legacy patterns.
Clean, consistently keyed data is what makes every later rule trustworthy. The next decision is which rules that data should feed.
Step 3: Configure scenarios and rules for your risk profile
Scenario and rule configuration turns the scoped risks into detection logic the engine runs. Map out-of-the-box (OOB) rules to your own risk profile rather than loading a generic rulebook like-for-like. Typical scenarios include the following four:
- Rapid movement of funds through an account soon after a deposit. Money that arrives and leaves within hours often signals pass-through activity.
- Structuring that keeps amounts just under reporting thresholds. Repeated deposits just below the limit are a classic sign of deliberate splitting.
- Activity routed through geographies outside the customer’s profile. Transfers to unexpected countries stand out against the customer’s usual pattern.
- Dormant accounts that suddenly turn active. A long-quiet account that suddenly moves large sums deserves a closer look.
Each scenario depends on specific core fields. Structuring logic needs cash flags and exact amounts. Dormancy logic needs each account’s last-activity date. A rule whose input field is missing never fires, and nobody notices. Tailored rules take longer to set up, but they generate fewer false positives later. To compare what monitoring engines offer for these scenarios, review these transaction monitoring software features.
Rules tied to verified fields can be tested against real behavior. That testing happens in the parallel run.
Step 4: Run both systems in parallel and tune thresholds
A parallel run operates the new engine beside the existing one for at least one full reporting cycle. Investigators compare both alert sets, explain every difference and tune thresholds before cutover.
- Threshold calibration lowers false positives without suppressing genuine suspicious activity. Analysts test each change against past cases before it goes live.
- Gap analysis catches feeds that dropped records during the overlap. Comparing record counts and totals between both systems exposes the gaps early.
- Segment phasing moves one product or customer group at a time. Each move is reviewed before the next segment starts.
This follows the strangler fig pattern: one segment moves to the new path while the old path keeps running. A longer overlap costs analyst hours. A single big-bang cutover, however, risks a window with no monitoring at all. Our guide to modern banking architecture components explains how this phased approach is built.
A tuned engine still needs owners and rules for change. Go-live is where that governance becomes formal.
Step 5: Go live with governance and an audit trail
Go-live hands the integration to named owners with documented controls that examiners can test. Level 1 (L1) analysts triage alerts. Level 2 (L2) investigators handle escalations and SAR decisions.
- Threshold-change approvals record why each threshold was set and who approved its last change. Examiners can then trace any threshold back to a documented decision.
- Configuration baselines, under the CM-2 baseline configuration control, freeze approved rule and pipeline settings. Any later change must go through approval, so settings do not drift unnoticed.
- Case management records each alert’s disposition and the analyst who closed it. That history shows how each alert was handled from triage to closure.
- Alert-to-source lineage links every alert to the core transaction that triggered it. It gives investigators and examiners a direct path from the alert to the posted entry.
Governance turns a working pipeline into a defensible one. Each of the four controls above gives an examiner something concrete to test. Older cores add their own hurdles, and those hurdles need patterns of their own.
Need Help Running These Five Steps on Your Core?
Share your core banking platform and monitoring tool, and our fintech team will map the right integration pattern, data feeds and phased rollout for your institution.

How Does Transaction Monitoring Integration With Legacy Core Banking Systems Work?
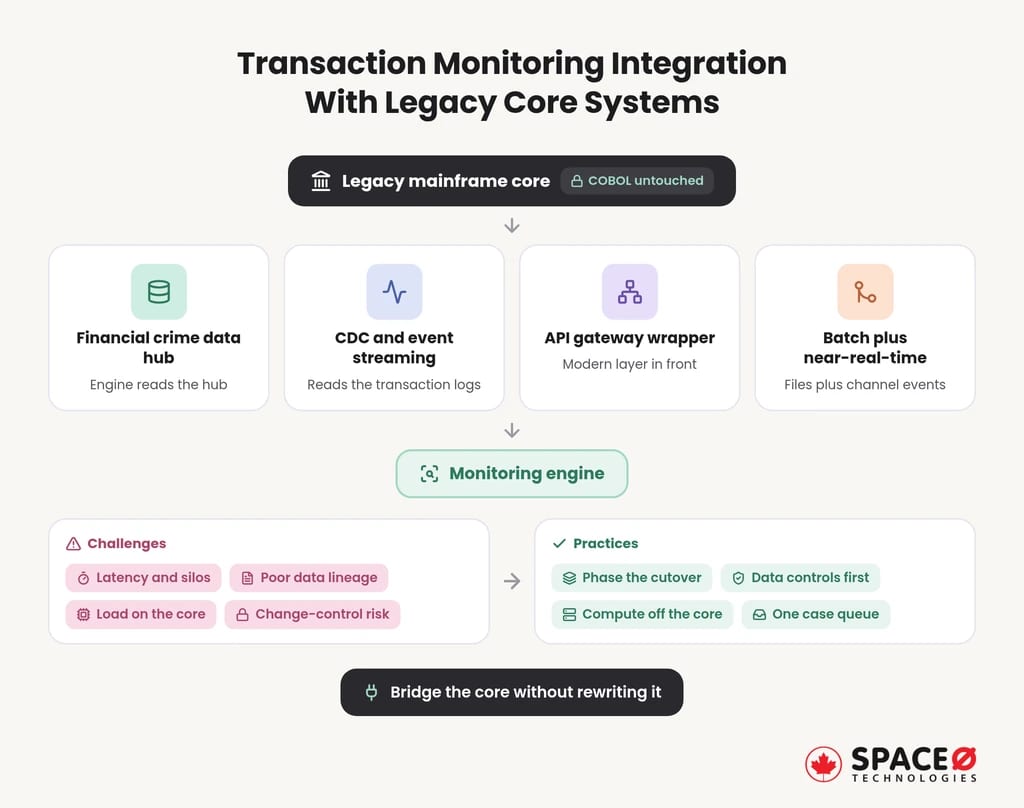
Legacy cores are decades-old, batch-driven mainframe platforms that must be bridged to real-time or near-real-time compliance engines. The monitoring connection has to land without destabilizing the core that posts deposits and settles payments. The five steps above still apply. What changes is how data leaves the core.
1. Use a centralized financial crime data hub
A centralized financial crime data hub consolidates structured and unstructured data from the core and its channels into one store. The monitoring engine reads the hub instead of the core. That decoupling shields the mainframe from monitoring queries. The constraint is that the hub’s refresh rate caps detection latency. The trade-off is a new data store to secure and govern. Choose a hub when several compliance functions need the same data.
2. Read the core with CDC and event streaming
CDC and event streaming capture changes from the core’s transaction logs or journals as they are written. A CDC tool publishes those changes to a stream for the engine. The core runs untouched, because CDC reads logs instead of querying tables. The constraint is that CDC needs readable logs, and some mainframe journals restrict access. The trade-off is that log format changes during core upgrades can break the parsers.
3. Wrap the core with an API gateway
An API gateway wrapper places a modern API layer in front of the core. The gateway exposes account and transaction data without touching COBOL or mainframe code. It suits cores that answer queries reliably but lack modern interfaces. The constraint is that every call still lands on the core. The trade-off is that the wrapper starts fast, but heavy polling can strain a fragile core. For a related build, see our banking API integration case study.
4. Combine batch files with near-real-time events
A batch-to-near-real-time hybrid keeps EOD and intraday files for AML pattern detection. Payments are intercepted in real time at the channel, before they reach the core. Files move as flat files over SFTP. Payment messages arrive in ISO 20022 or SWIFT formats. The constraint is the dual arrival clocks noted in step 2. The trade-off is extra reconciliation, in exchange for the safest path off a batch-only core. Our banking reconciliation software case study shows how a US commercial bank automated that matching.
5. Four challenges of monitoring a legacy core
Four challenges recur on almost every legacy integration.
- Data latency and silos: Batch cycles and separate channel systems leave the engine looking at yesterday.
- Poor data quality and lineage: Decades of field reuse leave codes whose meaning nobody documented.
- Operational load: Detection rules running on the core compete with posting and settlement for capacity.
- Change control and risk: Every core change needs regression testing, so teams avoid touching the core.
Each challenge points to the core itself as the bottleneck. The practices below route work around that bottleneck.
6. Four practices that keep a legacy integration audit-ready
Four practices address those challenges directly.
- Phase the cutover: Move monitoring by product or segment, as described in step 4, never in one switch.
- Build data controls first: Put data quality, lineage and metadata controls in place before the first rule goes live.
- Move compute off the core: Run detection in the hub or the engine, so the mainframe only serves data.
- Unify case management: Layer one case management view over legacy and new alert sources, so investigators work one queue.
A legacy core can feed modern monitoring when the bridge respects its limits. The deciding detail is the field-level contract behind every alert.
How Does Every Alert Trace Back to Its Source Transaction?
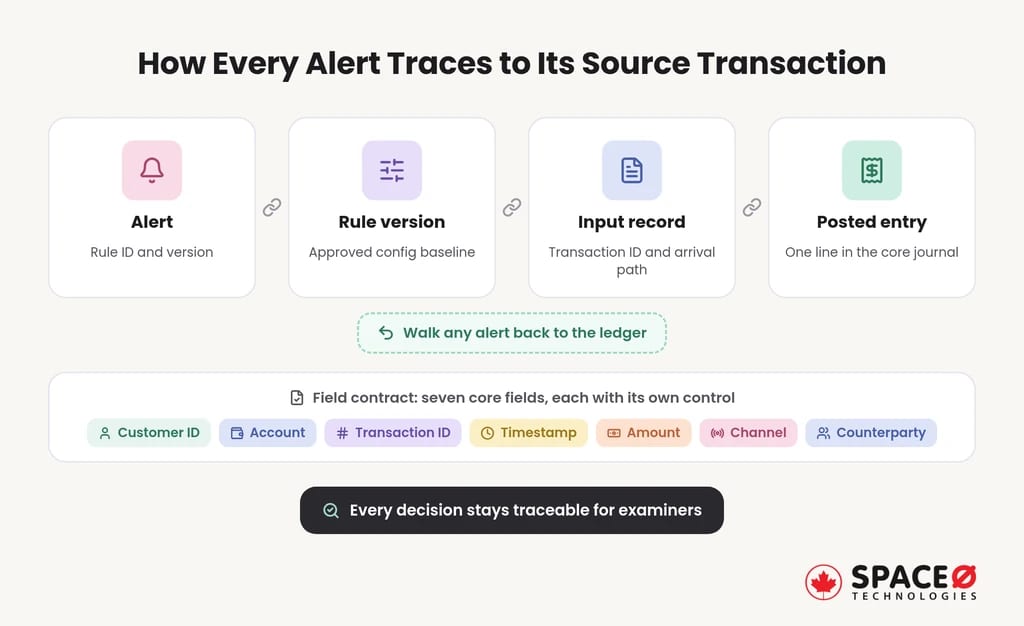
Every alert should trace back to one posted transaction in the core’s journal through a documented field contract. Most integration guidance stops at “connect the data.” The contract below shows what connecting actually requires, field by field.
Map seven core fields to the monitoring engine
Seven core fields carry most monitoring logic, and each needs its own control.
| Core field | Monitoring target | Completeness or reconciliation control |
|---|---|---|
| Customer ID | Party or customer profile key | Match against the KYC/CDD master; quarantine records with no match. |
| Account number | Account entity linked to the party | Reconcile open-account counts with the core each business day. |
| Transaction ID (core journal reference) | Transaction key | Compare record counts per batch or stream window against the core journal. |
| Timestamp | Event time in one time zone | Normalize to one zone; flag records that arrive later than the scoped latency. |
| Amount and currency | Transaction amount | Reconcile daily control totals with the core’s posted totals. |
| Channel | Channel code (wire, ACH, card, cash) | Map every core code; quarantine unmapped codes instead of defaulting them. |
| Counterparty | Counterparty name, account and institution | Populate from SWIFT or ISO 20022 fields; track the share left blank. |
The alert-to-ledger trace then runs in four links:
- The alert stores the ID and version of the rule that fired. This lets an examiner see exactly which logic raised the alert, even after the rule has changed.
- The rule version points to its approved configuration baseline. That baseline records the thresholds and settings in force on the day the alert fired.
- The input record carries the core transaction ID and its arrival path. The arrival path shows whether the record came through a real-time, batch or CDC feed.
- The transaction ID resolves to one posted entry in the core journal. That entry closes the loop, so the alert can be walked back to the ledger.
Match each legacy-core constraint to a pattern
Four core constraints decide the pattern more often than any vendor preference.
| Legacy-core constraint | Pattern to choose | Why it fits | Lineage control to add |
|---|---|---|---|
| Batch-only core | Batch file or ETL now, hybrid next | Works with existing EOD extracts | File-level record counts and control totals per run |
| No usable API | CDC off logs, or flat-file extracts | Reads data the core already writes | Log position stored with each event |
| Fragile performance | Data hub fed by CDC | Moves query load off the mainframe | Hub-to-core reconciliation each business day |
| Card and payment channels | API or event extraction at the gateway or processor | Catches payments before settlement | Gateway event ID linked to the later core posting |
Intercept upstream when the core cannot emit events
Intercept upstream at the payment channel instead. This gives the engine early sight of payments while the core stays untouched.
- Screen card and instant-payment events at the gateway or processor, where they already exist in real time. This catches payments before settlement, without adding load to the core.
- Shorten AML latency with intraday file drops over SFTP. Several smaller drops a day cut the lag of a single end-of-day batch.
- Add CDC on the journal later, once log access is approved. Reading the journal directly then brings the engine closer to real time.
The field contract above is built during discovery, then wired into the chosen pattern in phases. Each phase is signed off only after its field controls reconcile against the core.
With the contract defined, choosing an approach becomes a comparison of trade-offs. The table below sets those trade-offs side by side.
Which Integration Approach Fits Your Core: Real-Time, Batch, CDC or Hybrid?
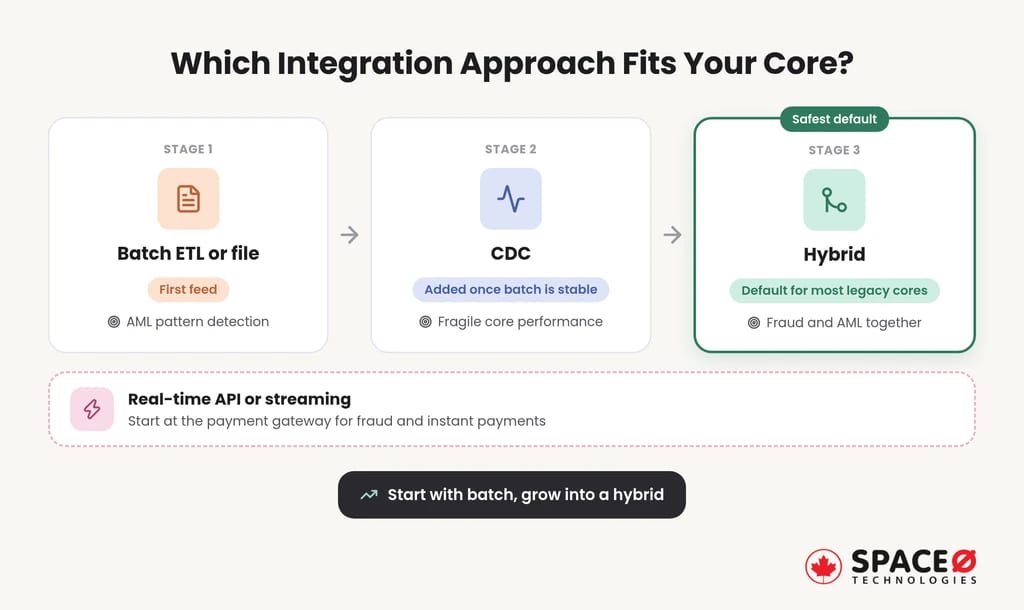
For most legacy cores, a hybrid of batch and real-time feeds is the safest default. Still, no single approach wins on every axis. The right choice depends on the core’s limits and on which risk you must catch first.
| Approach | Legacy-core fit | Impact on core | Latency | Lineage and audit effort | Cutover risk | Effort to reach parallel run | Phased approach: when to choose |
|---|---|---|---|---|---|---|---|
| Real-time API or streaming | Low unless the core exposes APIs | Medium; each call loads the core | Seconds | Medium; event IDs required | Medium | High | Start at gateways. Choose for fraud and instant payments. |
| Batch ETL or file | High | Low; reuses existing extracts | EOD or intraday | Low; file counts and totals | Low | Low | Use as the first feed. Choose for AML pattern detection. |
| CDC | Medium; needs log access | Low; reads logs only | Near real time | Medium; log positions tracked | Medium | Medium | Add once batch is stable. Choose when core performance is fragile. |
| Hybrid | High | Low to medium | Mixed by channel | High; two paths reconcile | Low when phased | Medium | Default for most legacy cores. Choose when fraud and AML both matter. |
Most legacy integrations start with batch and grow into a hybrid. That progression is what a phased plan is built to deliver.
Plan Your Core-to-Monitoring Integration Without Touching the Core
Space-O Canada maps your core data, regulatory exposure and cutover risk during discovery. Then one in-house team builds a phased connector examiners can trace.
How Does Space-O Canada Help Integrate Transaction Monitoring With Your Core?
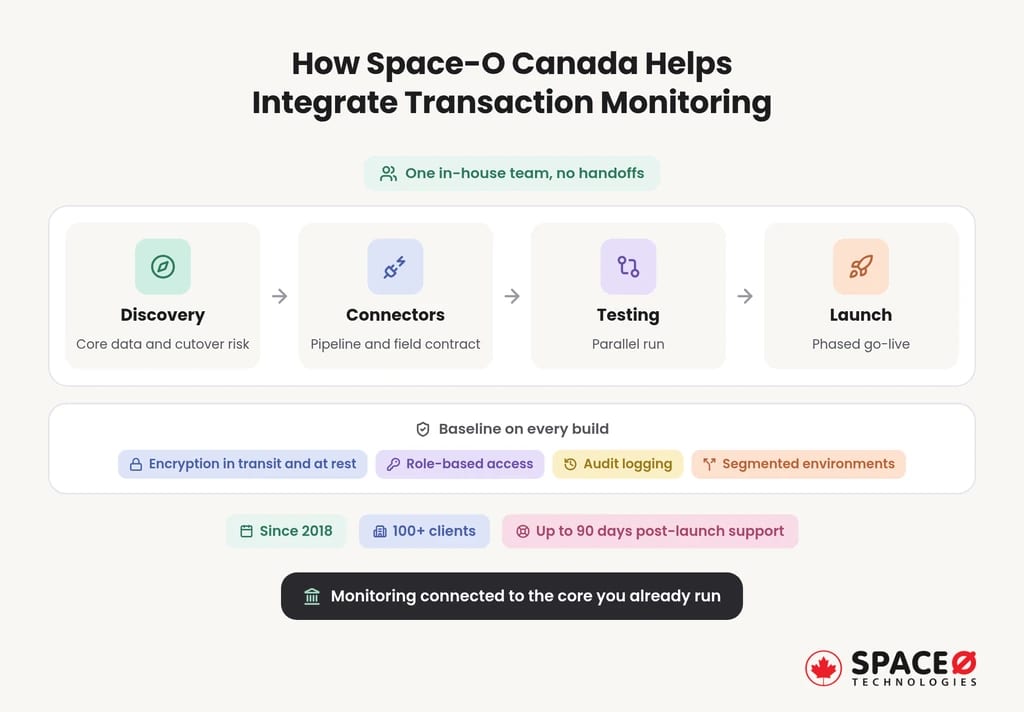
Space-O Canada helps institutions connect transaction monitoring to the core they already run, by building the data pipeline, the field contract and the phased rollout around it. Integrating transaction monitoring with a core banking system is a data-pipeline job before it is a rules job. Scope the risk, key every record consistently and tune through a full parallel run. Then govern every threshold change. Legacy cores need a bridging pattern chosen for their limits, not a rewrite. Space-O Canada has built financial software since 2018 for 100+ clients, including Fortune 500 companies. One in-house team carries discovery, connectors, testing and launch, with no handoffs.
Encryption in transit and at rest, role-based access control, audit logging and segmented environments are baseline on every build, not upgrades. Every project includes up to 90 days of post-launch support for bug fixes, OS updates and performance monitoring. Learn more about Space-O Canada, then bring your core’s constraints to a scoping call. The questions below cover what teams ask most before they start.
Frequently Asked Questions About Integrating Transaction Monitoring Software
How does transaction monitoring work?
Transaction monitoring applies rules to transaction data and routes flagged activity to people: L1 analysts triage alerts, and L2 investigators handle escalations and SAR decisions. The engine only sees the channels scoped in step 1, so a channel left out of scope is a channel no rule can cover.
What is the difference between KYC and transaction monitoring?
KYC/CDD establishes who the customer is, while transaction monitoring tests what that customer actually does. Decision rule: a transaction whose customer ID has no KYC/CDD match should be quarantined rather than scored, per the Customer ID control in the mapping table.
What are transaction monitoring rules?
They are the detection logic the engine runs, built from the scoped risks; the four typical scenarios are listed in step 3. The caveat: tailored rules take longer to set up than out-of-the-box ones, and their thresholds are only settled after at least one full reporting cycle of parallel run.
Why would a monitoring rule never fire after integration?
Usually because its input field is missing or unmapped, as step 3 explains. To catch it before go-live, apply the per-field controls in the mapping table and compare alert sets during the parallel run: a scenario that alerts in the old engine but stays silent in the new one points to a missing field.
Should transaction monitoring run in real time or in batch?
It depends on the use case, not the institution. Fraud interception needs events within seconds, before funds leave, so card authorizations, instant payments and outbound wires suit real-time feeds. Long-term AML patterns, such as structuring spread across weeks, can run on end-of-day batch. Most institutions run both modes and tag every record with its arrival path.
Can you integrate transaction monitoring with a legacy mainframe core without changing its code?
Yes. Four patterns keep the core untouched: a centralized financial crime data hub, CDC and event streaming that reads the core’s transaction logs, an API gateway wrapper, or a batch-to-near-real-time hybrid. The best fit depends on the core’s constraints, such as batch-only extracts, no usable API or fragile performance.
What is a parallel run in a transaction monitoring integration?
A parallel run operates the new engine beside the existing one for at least one full reporting cycle. Investigators compare both alert sets, explain every difference and tune thresholds before cutover. The overlap also catches feeds that dropped records, so gaps surface before the old system is switched off.


Let’s Discuss Your Idea
Share your idea with our fintech development team and get a practical breakdown of what you need to build, integrate, secure, and launch it.
 Your project is covered by an NDAYour information stays secure and confidential




What our clients say


When we set out to build our Estate Tax Planning Tool, we needed a development partner we could trust with something this complex and consequential. Space-O Canada brought the technical expertise and attention to detail needed to handle intricate tax calculations and edge cases. They communicated clearly, delivered on time without cutting corners, and built a product we trust completely.
 Ed Chetan EdwinFounder, CharityCalc
We partnered with Space-O Canada to build a fintech platform that could support secure transactions, third-party integrations, and future scalability. Their team understood our business requirements from the beginning and delivered a well-architected solution without unnecessary complexity. Communication was consistent, milestones were met on time, and every challenge was handled proactively.
 Michael CarterCo-Founder, Digital Payments Platform
The fintech app came out exactly the way I pictured in terms of functionality. I will refer future UI/UX clients to their team. During the testing phase of the app, it performed according to the initial designs in terms of functionality. Their team was dedicated to creating the best version of the app and provided their own ideas to improve it.
 Amanda LewisProduct Manager, Lending Platform
Our banking modernization project involved complex integrations and strict security requirements, and Space-O Canada handled both with confidence. They developed a reliable banking platform that improved operational efficiency while maintaining a smooth customer experience. Their structured development process and clear communication kept the project on track from start to finish.
 Daniel RobertsVP of Technology, Regional Bank
Our legacy insurance system created delays across policy management and claims processing. Space-O Canada developed a centralized platform that streamlined our workflows and improved efficiency across departments. The project was delivered on schedule, and the team’s understanding of insurance technology was evident throughout the engagement.
 Emily FosterOperations Director, Insurance Provider
Developing a trading platform requires speed, reliability, and technical precision. Space-O Canada delivered a solution that performs exceptionally well while supporting real-time market data and intuitive trading workflows. Their project management was excellent, and the team remained responsive throughout every stage of development.
 Ethan MorganChief Product Officer, Investment Platform
The fintech app was successfully launched, and users loved its sleek design and features. Space-O Technologies worked in an organized and collaborative manner, allowing them to achieve quality results. They also took the time to deeply understand the project. They were very organized and had a good track record.
 David WilsonFounder, Personal Finance App